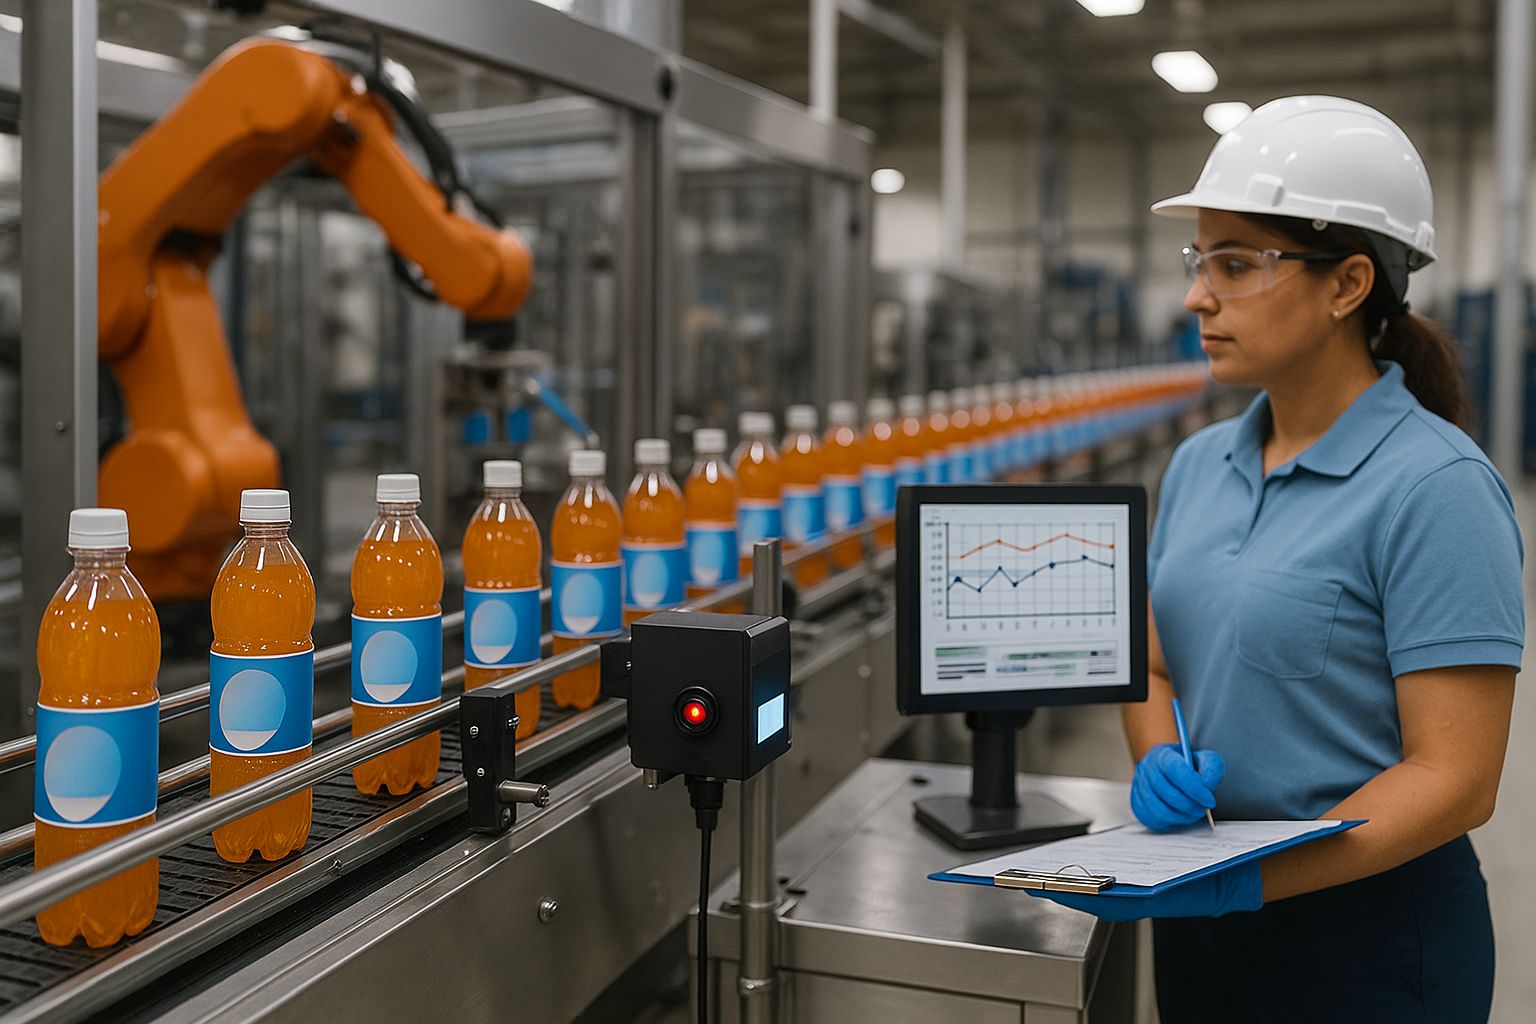
Automation, in-line vision, and SPC let CPG lines raise output without letting quality or margins slip.
Quick Answer:
Scale output without losing quality or margins. Lean flow, targeted automation, and in-line QC and SPC make higher throughput possible while maintaining consistency. Add predictive maintenance and a short list of guardrail metrics to prevent defects, downtime, and margin slippage.
Key Facts:
· Automation, in-line vision, and SPC let CPG lines raise output while keeping quality and margins intact.
· In-line quality checks and SPC catch drift before large off-spec runs accumulate [1].
· Predictive maintenance reduces unplanned downtime, the costliest form of lost output [3].
· Prioritizing quality avoids recall and rework costs that can dwarf prevention investment [4].
· Lean flow and targeted automation enable higher throughput and consistency when tied to real-time data [5].
Scaling means producing more units at stable quality and margin. It depends on steady flow, flexible capacity, and early quality signals that are built into the process, not added at the end.
When you define scaling this way, speed is a result of stability. Without stability, higher speeds only multiply defects and rework.
Lean aligns production to actual demand, exposes bottlenecks, and reduces the work-in-process that hides problems. Start with value stream mapping [5], set takt time, and level the schedule, then remove the constraints you reveal.
Just-in-time material flow and standard work stabilize the base so added volume does not amplify defects. Flow comes first, speed follows.

Scale readiness checklist, lean core:
· Current state value stream mapped, bottlenecks identified
· Takt time set, schedule leveled to demand bands
· Standard work and visual controls at each station
· Kanban or JIT in place for A items, excess WIP removed
· First pass yield tracked at the constraint
Automate narrow, repetitive, high-variance tasks where machines outperform people, such as case packing, label inspection, and palletizing. Keep skilled operators on problem-solving, changeovers, and exception handling.
Pair automation with real-time analytics and predictive maintenance to reduce stoppages that swallow margin [6].
Good early candidates:
· End-of-line packaging and labeling for consistency and throughput
· In-line vision for label, print, date, and code verification
· Cobots for ergonomically risky pick-and-place tasks
Move from end-of-line inspection to in-line detection and prevention. Use sensors and SPC to set control limits and act at the first sign of drift [2].
Give teams stop-the-line authority, daily gemba walks, and small Kaizen cycles. This culture prevents defects from multiplying at higher speeds.
Guardrails at scale:
· In-line checks tied to defects per million targets
· SPC charts visible at the station, rules for action defined [2]
· Andon or stop authority plus rapid response standard work
Track a short list of leading indicators that catch risk early and a couple of lagging indicators to confirm results. Avoid dashboard bloat and choose metrics that drive same-shift action.
Map the flow, quantify the constraint, and pilot a single in-line check plus one targeted automation step where defects or fatigue hit hardest. Lock in the gains with standard work, then apply the same approach to the next bottleneck.
Ready to plan your capacity expansion? Contact us below today.
[1] ASQ — What is Statistical Process Control (SPC)? (accessed Aug 31, 2025). https://asq.org/quality-resources/statistical-process-control
[2] ASQ — Control Chart (Overview). (accessed Aug 31, 2025). https://asq.org/quality-resources/control-chart
[3] McKinsey & Company — Manufacturing: Analytics unleashes productivity and profitability. Aug 14, 2017. https://www.mckinsey.com/capabilities/operations/our-insights/manufacturing-analytics-unleashes-productivity-and-profitability
[4] Kearney — How can traceability reduce the scope and cost of product recalls? Jun 13, 2024. https://www.kearney.com/industry/agriculture-food/article/how-can-traceability-reduce-the-scope-and-cost-of-product-recalls
[5] Lean Enterprise Institute — Value Stream Mapping. https://www.lean.org/lexicon-terms/value-stream-mapping/
[6] McKinsey & Company — Prediction at scale: How industry can get more value out of maintenance. Jul 22, 2021. https://www.mckinsey.com/capabilities/operations/our-insights/prediction-at-scale-how-industry-can-get-more-value-out-of-maintenance
